
One SAMPLE month, ten new customers, and the payback formulas that do not land on the same month.
On this page
The short answer
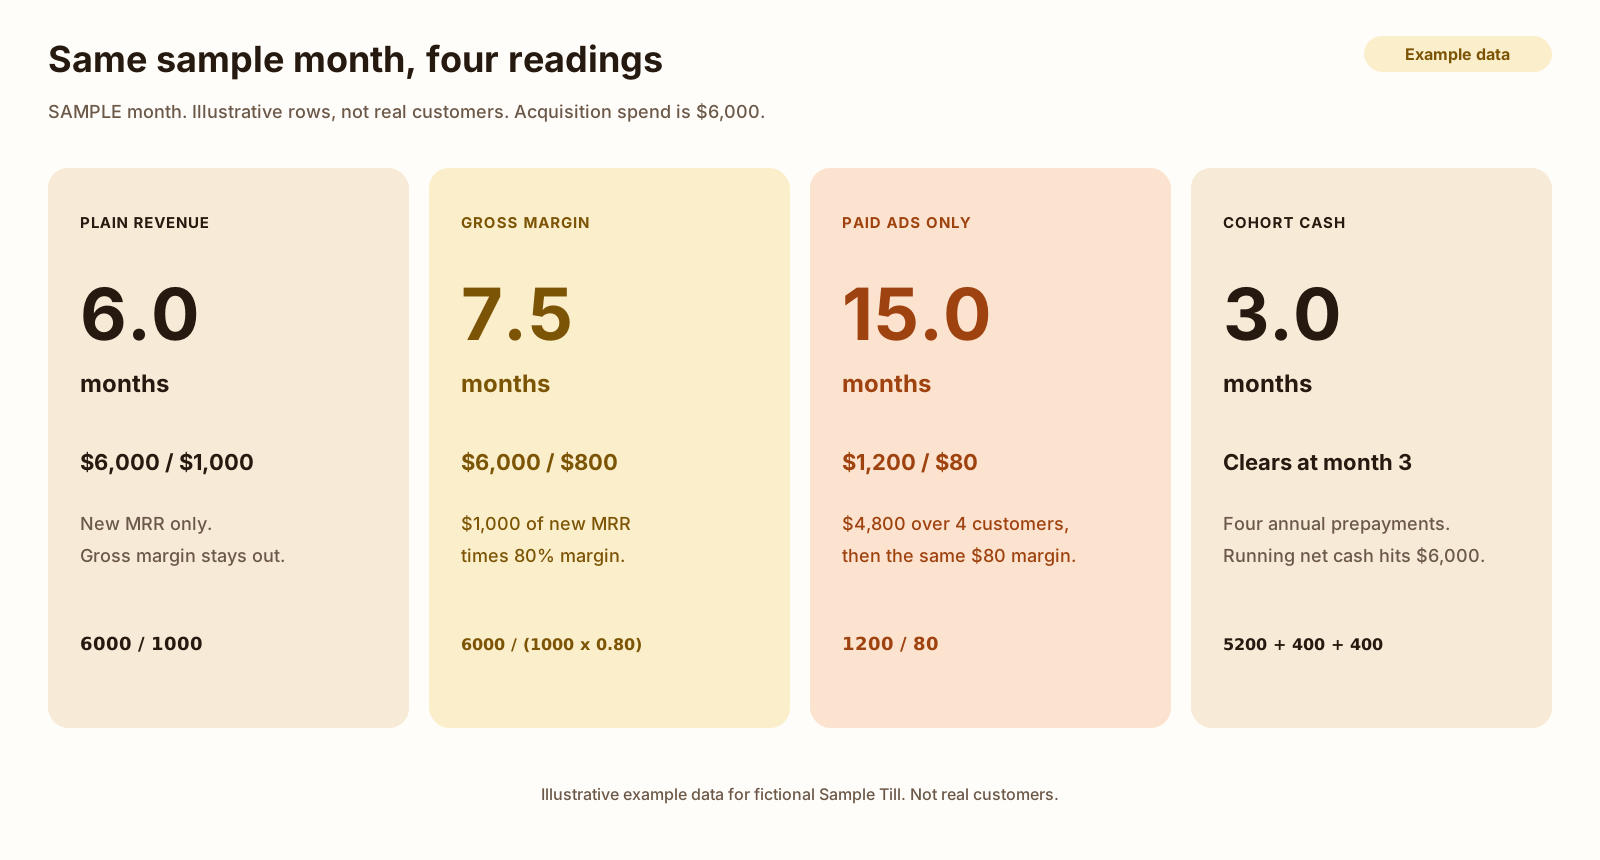
The CAC payback period is how many months of gross profit it takes to cover acquisition spend: divide that spend by the product of new MRR and gross margin. On the sample month, $6,000 divided by $800 is 7.5 months, and the same $6,000 divided by $1,000 of new MRR is 6.0 months. Paid ads alone are $1,200 divided by $80, which is 15.0 months, and the cash clears the $6,000 in month 3. The month is illustrative example data for a fictional product, not real customer data.
What the CAC payback period counts
The CAC payback period is a count of months. The numerator is what you spent to acquire the new customers. The denominator is the gross profit those customers add each month. Divide, and you have the months.
The plain version divides acquisition spend by new MRR. The margin version divides that same spend by the product of new MRR and gross margin. Per customer, those are CAC divided by MRR, and CAC divided by monthly gross profit. CAC itself is the spend divided by the count of new customers.
New MRR here is the monthly price from How to calculate MRR. An annual contract is divided by 12 before it is a line of MRR. This page starts from that monthly number, then keeps a second column for the cash that actually arrived.
Stripe’s CAC payback page, updated September 10, 2024, prints three lines: CAC equals acquisition costs divided by new customers, monthly profit equals monthly revenue minus monthly costs, and the payback period equals CAC divided by that monthly profit. Their own example is $50,000 divided by 500 customers, which is a $100 CAC, then $100 of revenue minus $20 of cost, then $100 divided by $80, which they state as 1.25 months. Those are Stripe’s figures.
The opening of that same page says the metric measures how long a customer takes to generate enough revenue to cover the cost. The formula under that sentence uses profit, not revenue. Stripe’s SaaS metrics page, updated April 13, 2026, is the revenue version. It divides CAC by the customer’s MRR. Their example there is a $1,000 CAC and $100 of MRR, which they state as 10 months. Same company, two denominators.
Wall Street Prep, updated September 17, 2024, writes the cohort form: sales and marketing expense divided by new MRR times gross margin. Their own example is a $5,600 spend, 10 customers, $500 of new MRR, and an 80% margin, which they state as 14 months. Those are their figures. The months below are the sample sheet.
The formula does not include churn. A customer who leaves before the months are up stops contributing gross profit, and the printed division does not notice. Logo churn and revenue churn, on a different sample month, are in How to calculate churn rate. Expansion from people who were already customers is a different question again. That rate is how to calculate NRR.
The sample month
Sample Till is fictional. The sheet is one SAMPLE month of new customers. The rows are illustrative example data, not real customer data. Nothing here was measured from a live business. It is a different sheet from the Sample Desk month in the churn guide, and a different sheet from the Sample Ledger year in the NRR guide. Do not add the three together.
Ten customers start in the month. Each one is $100 of MRR. New MRR is $1,000.
Six of them pay $100 a month. Four of them pay $1,200 once, for the year. 1,200 divided by 12 is 100, so the annual rows are also $100 of MRR. The $1,200 is cash. It is not an extra $1,100 of MRR.
- One row per new customer, with channel, plan, MRR, and the cash collected in month 1
- Acquisition spend split into the paid invoice and everything else, so blended CAC and paid CAC cannot share a denominator by accident
- A gross margin input, and a delivery cost each month, so the margin formula and the cash running total can both be checked
Download the CAC payback template (CSV)
| Rows | Channel | Plan | Logos | MRR | Cash in month 1 |
|---|---|---|---|---|---|
| M01 to M04 | Other | Monthly, $100 | 4 | $400 | $400 |
| M05, M06 | Paid ads | Monthly, $100 | 2 | $200 | $200 |
| A01, A02 | Other | Annual, $1,200 | 2 | $200 | $2,400 |
| A03, A04 | Paid ads | Annual, $1,200 | 2 | $200 | $2,400 |
4 + 2 + 2 + 2 = 10 logos. 400 + 200 + 200 + 200 = 1,000 of MRR. Cash in month 1 is 400 + 200 + 2,400 + 2,400 = 5,400.
Paid logos are M05, M06, A03, and A04. That is 4. The other six did not come from the ad.
| Invoice | Amount | Customers it is divided by | CAC |
|---|---|---|---|
| Paid ads | $4,800 | 4 paid logos | $1,200 |
| Content and tools | $1,200 | 6 other logos | $200 |
| Both, the blended total | $6,000 | All 10 | $600 |
4,800 + 1,200 = 6,000. 4,800 divided by 4 is 1,200. 1,200 divided by 6 is 200. 6,000 divided by 10 is 600.
The $6,000 is the new-customer invoices on the sheet. There is no salary in the base month. The SaaS CFO’s page says to start from fully loaded sales and marketing and to keep existing-customer costs out of CAC. This sheet is already only the new-customer invoices. It is not a fully loaded payroll. A salary scenario is a later row, labeled as a scenario.
Gross margin on the sheet is 80%. Delivery cost is $20 per customer per month of service, on $100 of MRR, so monthly gross profit is $80. That $20 is an example input. It is not a measured hosting bill. Cohort gross profit is 10 times 80, which is $800. Cohort delivery cost is 10 times 20, which is $200.
Gross margin and plain revenue
Hold the $6,000 and the $1,000 still. The two readings change the denominator.
Plain revenue payback is 6,000 divided by 1,000, which is 6.0 months. That is Stripe’s SaaS metrics page, and it is also the per-customer form 600 divided by 100.
Gross-margin payback is 6,000 divided by 800, which is 7.5 months. The 800 is 1,000 times 0.80. Per customer, that is 600 divided by 80. Wall Street Prep’s cohort form and the per-customer form land on the same 7.5 here, because every customer has the same $100 of MRR.
Stripe’s profit formula is the 7.5 as well. Monthly revenue $100 minus monthly cost $20 is $80 of profit, and 600 divided by 80 is 7.5. On these dollars, “times 80%” and “minus $20” are the same denominator. 1,000 times 0.80 is 800, and 1,000 minus 200 is 800.
Chargebee’s glossary divides CAC by MRR and does not multiply by a margin. Their own example is a $200 CAC and a $20 monthly price, which they state as 10 months. On this sheet their formula is the 6.0, not the 7.5.
HiBob’s page writes CAC divided by net new MRR minus the average cost to serve. Read with the subtraction inside the denominator, that is 6,000 divided by (1,000 minus 200), which is the same 7.5. The FAQ on that page prints the line without parentheses: customer acquisition cost, divided by revenue, minus average cost of service. Read left to right, that is (6,000 divided by 1,000) minus 200, which is 6 minus 200, which is −194. The −194 is what the missing parentheses do. It is not a payback to report.
Capchase’s glossary, dated September 5, 2024, says to divide CAC by the monthly margin or by MRR. The “or” is the 7.5 and the 6.0.
Blended CAC and paid CAC
The $600 and the $1,200 are both on the sheet. They answer different questions.
Blended margin payback uses the $600 and the $80. 600 divided by 80 is 7.5 months. Paid-only margin payback uses the $1,200 and the same $80. 1,200 divided by 80 is 15.0 months. The cohort form of the paid reading is 4,800 divided by (4 times 80), which is 4,800 divided by 320, which is also 15.0.
Paid-only plain revenue is 1,200 divided by 100, which is 12.0 months. The other channel, margin only, is 200 divided by 80, which is 2.5 months. The 2.5 is the content and tools invoice. It is not a benchmark.
Two traps use the right dollars and the wrong count.
Paid spend divided by all 10 customers is 4,800 divided by 10, which is a $480 CAC. Then 480 divided by 80 is 6.0 months. Plain revenue payback is also 6.0 months. The divisions are 4,800 divided by 800, and 6,000 divided by 1,000. They match on this sheet. They are not the same formula.
All spend divided by the 4 paid customers is 6,000 divided by 4, which is a $1,500 CAC. Then 1,500 divided by 80 is 18.75 months. That reading charges the content invoice to people who did not come from it.
A salary scenario adds $3,000 to the blended spend and leaves the ad invoice at $4,800. Spend becomes 9,000. Margin payback becomes 9,000 divided by 800, which is 11.25 months. Plain payback becomes 9,000 divided by 1,000, which is 9.0 months. Paid-only margin payback stays 15.0, because the salary is not inside the $4,800. The scenario is on the sheet so the move is visible. It is not the base month.
Monthly plans and annual prepay
Hold CAC at the blended $600, so the plan is the only thing that changes. A monthly customer and an annual customer both have $100 of MRR. Gross-margin payback is 600 divided by 80, which is 7.5 months, for both. The MRR method cannot see the prepayment.
Cash can.
The monthly customer pays $100 and the sheet spends $20 delivering the month. Net cash is $80. The running total is 80, 160, 240, 320, 400, 480, 560, 640. Month 7 is $560, which is $40 short of $600. Month 8 is $640, which is $40 past it. The division says 7.5 because 7.5 times 80 is 600. The first whole month where the running total is at least $600 is month 8.
- M1$80
- M2$160
- M3$240
- M4$320
- M5$400
- M6$480
- M7$560
- M8$640
The annual customer pays $1,200 in month 1. Delivery cost that month is still $20. Net cash is 1,200 minus 20, which is $1,180. $1,180 is greater than $600, so the running total clears the CAC inside month 1. 600 divided by 1,180 is 30/59 of a month, which is 0.508 to three decimals. The sheet stores both. Later months collect no more subscription cash from that customer. The MRR method still says 7.5.
The trap is to skip the divide-by-12. Treat the $1,200 as MRR, apply 80%, and the denominator is 960. 600 divided by 960 is 0.625 months. That number is the arithmetic of forgetting the 12. It is not the cash reading, and it is not the MRR reading. The MRR reading divides first. 1,200 divided by 12 is 100, and 600 divided by 80 is 7.5.
Books the year as MRR
Treat $1,200 as one month
600 divided by 960 is 0.625 months. The 960 is 1,200 times 80%. The yearly price was never divided by 12.
- $1,200 as MRR
- 0.625 months
Divides by 12 first
Keep MRR at $100
1,200 divided by 12 is $100 of MRR. Gross-margin payback stays 600 divided by 80, which is 7.5 months. Cash is separate: month-1 net cash is $1,180.
- $100 of MRR
- 7.5 months
The cohort mixes the two plans, so the cash and the MRR method part company.
Month 1 cash in is $5,400. Delivery cost is $200. Net cash is $5,200. That is $800 short of the $6,000.
Month 2 cash in is $600, from the six monthly plans. The annual plans do not invoice again. Delivery cost is still $200, because all ten are still being served. Net cash is $400. The running total is $5,600.
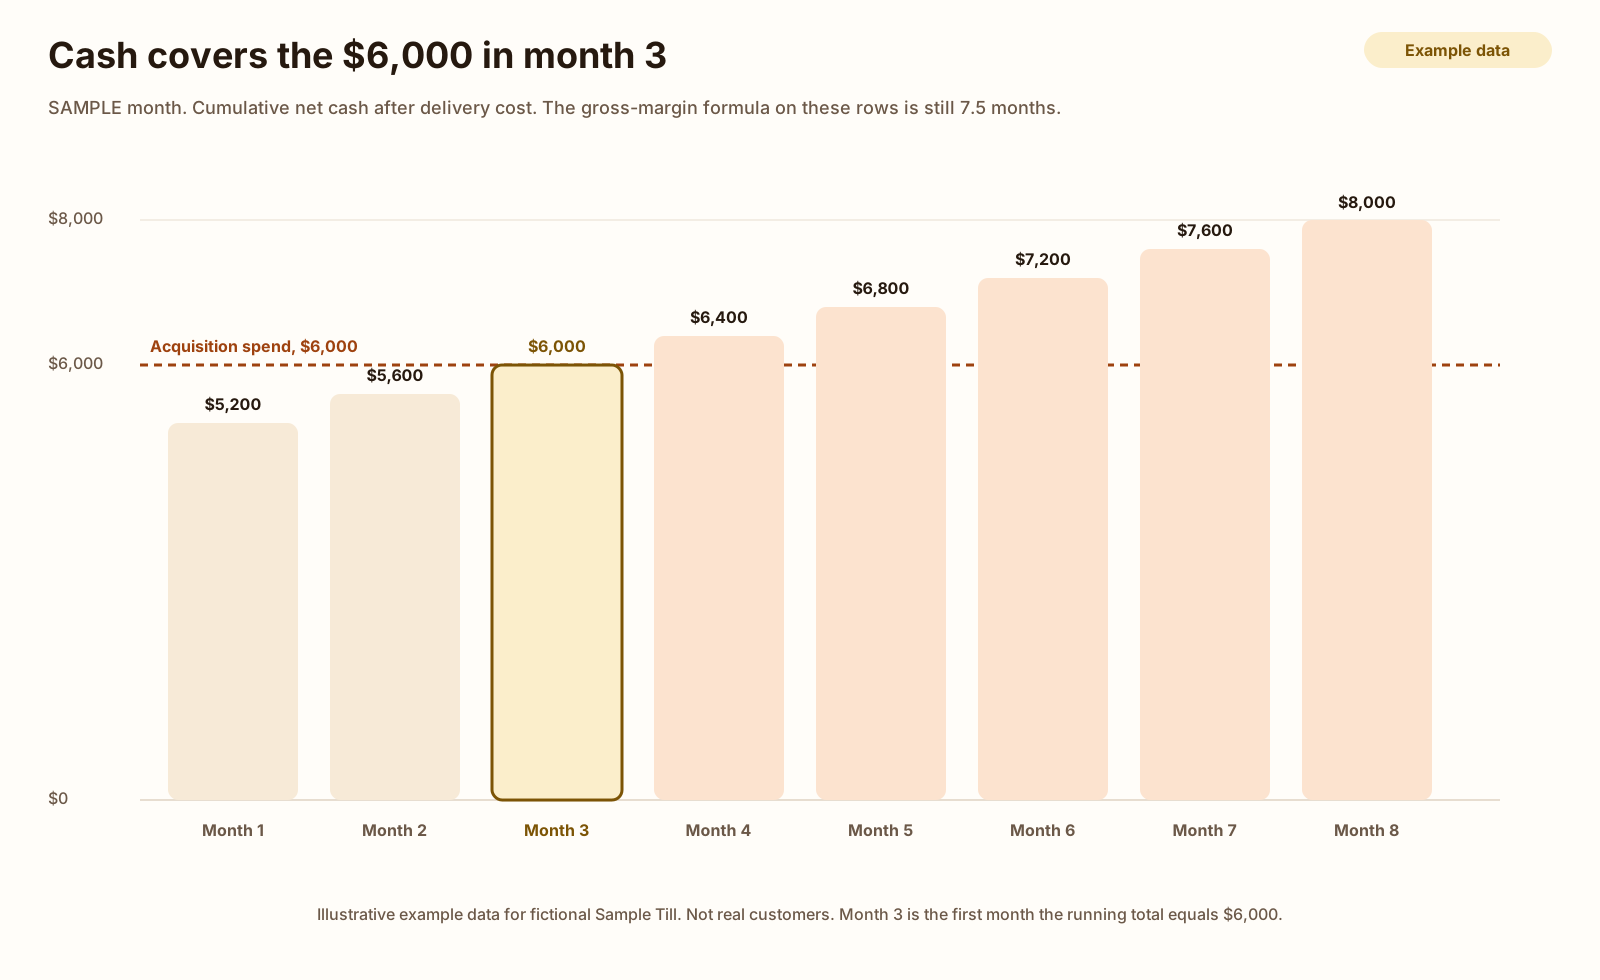
Month 3 adds another $400. The running total is $6,000. Cohort cash payback is 3.0 months.
| Month | Cash in | Delivery cost | Net | Running total |
|---|---|---|---|---|
| 1 | $5,400 | $200 | $5,200 | $5,200 |
| 2 | $600 | $200 | $400 | $5,600 |
| 3 | $600 | $200 | $400 | $6,000 |
| 4 | $600 | $200 | $400 | $6,400 |
| 8 | $600 | $200 | $400 | $8,000 |
5,200 plus 400 plus 400 is 6,000. From month 1, the running total is 5,200 plus 400 for each later month. Month 8 is 5,200 plus 7 times 400, which is 8,000.
If all ten customers had been on the monthly plan, month-1 cash would be $1,000, delivery cost would stay $200, and net cash would be $800 a month. 6,000 divided by 800 is 7.5 months. Cash would match the margin formula. The 3.0 exists because four customers prepaid. It is not a better margin.
The base formula also assumes the customer keeps paying. The SaaS CFO’s page says the payback period does not factor in churn. On a scenario row, the monthly customer leaves after month 6. Cumulative gross profit is 6 times 80, which is $480. That is $120 short of the $600. The division still prints 7.5. The customer is gone. The base month does not apply that scenario.
| Reading | Division | Months |
|---|---|---|
| Plain revenue, blended | 6,000 / 1,000 | 6.0 |
| Gross margin, blended | 6,000 / 800 | 7.5 |
| Paid only, plain revenue | 1,200 / 100 | 12.0 |
| Paid only, gross margin | 1,200 / 80 | 15.0 |
| Other channel, gross margin | 200 / 80 | 2.5 |
| Paid spend over all 10 logos, then margin | 480 / 80 | 6.0 |
| All spend over the 4 paid logos, then margin | 1,500 / 80 | 18.75 |
| Cohort cash | 5,200 + 400 + 400 | 3.0 |
| One annual price booked as MRR | 600 / 960 | 0.625 |
| Salary added, gross margin | 9,000 / 800 | 11.25 |
| All monthly, cash | 6,000 / 800 | 7.5 |
The salary row and the all-monthly row are scenarios. The 7.5 in the second row is the base gross-margin reading. The 7.5 in the last row is the cash counterfactual. Same months, different questions.
-
7.5 months
Gross margin, blended spend
Sample sheet -
6.0 months
Plain revenue, no margin
Sample sheet -
15.0 months
Paid ads only, with margin
Sample sheet -
3.0 months
Cohort cash, mixed plans
Sample sheet
The 0.625 reading is in the table and off this chart. It is a fraction of a month, and the bars are the readings that take more than a month. The division is 600 divided by 960.
The same form is the CAC payback calculator.
The form starts on the base month: 10 customers, 4 of them paid, 4 of them annual, $100 of MRR each, a $1,200 annual price, $6,000 of spend, $4,800 of that in paid ads, and an 80% margin. The headline is 7.5 months. Plain revenue is 6.0. Paid-only margin payback is 15.0. Cohort cash is 3.0. Change the annual count to 0 and the cash reading moves to 7.5, because the prepayments are gone.
What the cited pages count
The pages were checked on October 27, 2026. The months above are the sample sheet. The pages supply the formulas, and a few of them state a target. None of those targets was measured from Sample Till.
Stripe’s payback page uses profit in the formula and says a period of 12 months or less is typically considered healthy for SaaS. The same section says high-performing SaaS businesses often achieve five to seven months. The comparison table on that page repeats 12 months or less as the SaaS benchmark. Stripe’s metrics page, updated April 13, 2026, divides by MRR instead. Their worked examples, 1.25 months and 10 months, are theirs.
Wall Street Prep’s formula multiplies new MRR by gross margin. The page says most viable SaaS startups have a payback of fewer than 12 months. It also says the period has to be read with the customer mix and the billing cycle, not as a single cutoff. Their 14 month example is their example.
The SaaS CFO defines the period as CAC divided by the gross margin dollars from that customer. If the revenue input is ARR, multiply by 12 to get months. If the input is MRR, drop that 12. The page says the formula does not include churn or the time value of money. The byline shows September 25, 2026, and a note says the post was updated March 25, 2025. This check used the page as it loaded on October 27, 2026. Benchmark figures on that page are attributed to Benchmarkit and sit in images. They are not reprinted here.
Chargebee’s glossary uses CAC divided by MRR. The page says a SaaS business is in good health if payback is between 5 and 12 months, and that anything under 12 months is a good sign. Their $200 divided by $20 example is their example.
CFI’s page, published May 6, 2024, divides CAC by MRR per customer times gross margin, and says a strong target is generally less than 12 months. The steps also mention expansion revenue. This sample has no expansion, so that wider MRR and new MRR are the same $1,000. CFI’s first example is a $200 CAC, $100 of MRR, and a 75% margin, stated as approximately 2.67 months. 200 divided by 75 is 2.666…, which rounds to 2.67. Those are CFI’s figures.
Airtree’s page, dated October 23, 2024, calls the metric fully loaded CAC payback: the months of gross profit it takes to repay sales and marketing. The text says the MRR in the formula should be net new MRR, which they define as expansion plus new MRR minus churned MRR. This base month has no expansion and no churn, so that net new MRR is the same $1,000, and the margin reading stays 7.5. Their rule of thumb, in the text, is under 12 months for SMEs, under 18 for the mid-market, and under 24 for enterprise. A chart on the page is sourced to ICONIQ Growth. The figures inside that image are not reprinted here.
HiBob’s subtraction form matches the 7.5 when the cost to serve stays inside the denominator. The FAQ line, without parentheses, is the −194 reading. The page says a strong SaaS target is typically 12 months or less, and that some aim closer to 5 to 7 months.
Capchase offers monthly margin or MRR in one sentence. On this sheet, pick one and label it. The form on this page defaults to the margin reading.
More of the money work for a one-person SaaS sits on Money and ops.
Copy the template
The file is the SAMPLE month. Ten customer rows, two spend rows, eight month rows, then the totals. Every customer row is marked example data. The formula column is the division, written so a spreadsheet can calculate it. Replace the rows. Do not add your own customers on top of Sample Till.
mrr is the monthly amount, after dividing an annual price by 12. cash_in on a customer row is what that customer paid in month 1. delivery_cost is the $20. Summary value cells are the totals and the month counts. Scenario rows are named salary_scenario, all_monthly_counterfactual, and churn_scenario. They are not in the base 7.5.
Download the CAC payback template (CSV)
section,id,channel,plan,mrr,cash_in,delivery_cost,net_cash,cumulative_net_cash,value,formula,notes
customer,M01,other,monthly,100.00,100.00,20.00,80.00,,,,Example data. Monthly plan. Counted in the other-channel 6, not in the paid 4. Not a real customer.
customer,A01,other,annual,100.00,1200.00,20.00,1180.00,,,,"Example data. Annual price 1200 collected in month 1. MRR is 1200 divided by 12. Month-1 net cash is 1200 minus 20. Not a real customer."
spend,paid_ads,,,,,4800.00,,,,4800.00,=4800,"Example data. Paid ad invoice for the month. The whole 4800 sits inside the 6000. Not a real invoice."
spend,other_acquisition,,,,,1200.00,,,,1200.00,=1200,"Example data. Content and tools invoice assigned to new customers. Not a salary. Not a real invoice."
month,M1,,,,5400.00,200.00,5200.00,5200.00,,=5400-200,"Example data. Cash in is 6 times 100 plus 4 times 1200. Delivery cost is 10 times 20."
month,M3,,,,600.00,200.00,400.00,6000.00,3.0,=5600+400,"Example data. Cumulative net cash equals the 6000 spend. Cohort cash payback is 3.0 months."
summary,plain_payback_months,,,,,,,,,,6.0,=6000/1000,Blended spend divided by new MRR. No gross margin.
summary,margin_payback_months,,,,,,,,,,7.5,=6000/800,Blended spend divided by new MRR times gross margin.
summary,paid_margin_months,,,,,,,,,,15.0,=1200/80,Paid CAC divided by monthly gross profit. Also 4800 divided by 320.
summary,cohort_cash_months,,,,,,,,,,3.0,=5200+400+400,Running net cash equals 6000 at the end of month 3.
summary,annual_booked_as_mrr_months,,,,,,,,,,0.625,=600/(1200*0.80),The 1200 is used as MRR. The forgot-to-divide-by-12 reading.
The download has every customer, every month, and the scenario rows. The block above is the shape.
CAC payback calculator The sample month as a form. The headline is gross-margin payback. The starting inputs are sample data. Free tool How to calculate MRR, and what not to count Divide an annual price by 12 before it is MRR. That rule is why the $1,200 on this sheet is $100 a month. Guide How to calculate churn rate when formulas disagree The payback division assumes the customer keeps paying. Churn, on a different sample month, is the rate for when they do not. Guide How to calculate NRR when formulas disagree Expansion from customers you already had is a different numerator. This sheet's new MRR leaves it out. GuideFAQ
What is the CAC payback period?
It is the number of months of gross profit it takes to cover what you spent to acquire a customer. On the sample sheet the spend is $6,000 and the gross profit on new MRR is $800, so the period is 7.5 months. The rows are example data for a fictional product.
What is the CAC payback period formula?
Divide acquisition spend by the product of new MRR and gross margin. On the sample sheet that is $6,000 divided by ($1,000 times 80%), which is $6,000 divided by $800, which is 7.5 months. Per customer, the same reading is the $600 blended CAC divided by $80 of monthly gross profit.
Should gross margin be in the CAC payback formula?
The pages do not agree. Stripe’s CAC payback page, updated September 10, 2024, divides CAC by monthly profit, which is revenue minus the cost to serve. Stripe’s SaaS metrics page, updated April 13, 2026, divides CAC by MRR and leaves the margin out. On this sheet those two readings are 7.5 months and 6.0 months.
What is the difference between blended CAC and paid CAC?
Blended CAC divides every acquisition dollar by every new customer. Paid CAC divides the ad invoice by the customers who came from the ad. On the sample sheet blended CAC is $6,000 divided by 10, which is $600, and paid CAC is $4,800 divided by 4, which is $1,200. Margin payback is 7.5 months blended and 15.0 months on the paid slice.
Do annual plans shorten the CAC payback period?
Not on the MRR formula. An annual price of $1,200 is $100 of MRR after you divide by 12, so gross-margin payback stays 7.5 months, the same as a $100 monthly plan. Cash is different. The cohort’s running net cash covers the $6,000 at the end of month 3, because four customers paid the year up front. The divide-by-12 rule is how to calculate MRR.
What is a good CAC payback period?
This page does not pick one from the sample sheet. Stripe’s CAC payback page, updated September 10, 2024, says 12 months or less is typically considered healthy for SaaS, and that high-performing SaaS businesses often reach five to seven months. Airtree’s page, dated October 23, 2024, states a rule of thumb under 12 months for SMEs, under 18 for the mid-market, and under 24 for enterprise. Those are their statements. The 7.5 on this sheet is not one of them.
Sources
- What is the CAC payback period? (Stripe) Checked
- Essential SaaS metrics (Stripe) Checked
- CAC Payback Period (Wall Street Prep) Checked
- How I Calculate the CAC Payback Period (The SaaS CFO) Checked
- CAC Payback Period glossary (Chargebee) Checked
- CAC Payback Period (Corporate Finance Institute) Checked
- CAC Payback and LTV/CAC Ratio (Airtree Ventures) Checked
- CAC payback period explained (HiBob) Checked
- What is CAC Payback (Capchase) Checked